Announcing Stonemq: A high-performance and efficient message queue developed in Rust
CommentTL;DR:
1.Codebase: https://github.com/jonefeewang/stonemq
2.Current Features (v0.1.0):
- Supports single-node message sending and receiving.
- Implements group consumption functionality.
- Fully compatible with Kafka’s client-server communication protocol, enabling seamless client-side migration without requiring modifications.
3.Goal:
- Aims to replace Kafka’s server-side functionality in massive-scale queue cluster.
- Focused on reducing operational costs while improving efficiency.
4.Technology:
- Entirely developed in Rust.
- Utilizes Rust Async and Tokio to achieve high performance, concurrency, and scalability.
5.Preliminary Performance Testing:
Setup: The comparison between Kafka 2.6.0 and StoneMQ (v0.1.0) was conducted using Kafka 2.6.0’s built-in client producer benchmark tool. The tests were conducted on an Apple 2023 MacBook Pro (12 CPU cores, 18 GPU cores, 512GB SSD), with both systems operating in single-node, single-replica mode. You can reproduce these tests by building the project locally and modifying StoneMQ’s configuration file. For detailed instructions, refer to the project’s README file.
Results:
Kafka’s performance exhibited noticeable fluctuations as the number of partitions increased, while StoneMQ maintained stable performance.
Memory Usage:
- Kafka consumed over 400 MB of memory with 1,000 partitions.
- StoneMQ used only 44 MB under the same conditions.
Note: The comparison is not entirely fair, as the test machine lacked dual-disk support. Consequently, StoneMQ’s splitting tasks were not enabled during testing, and queue data was not written to disk.


Stonemq aims to outperform Kafka in scenarios with massive-scale queue clusters, delivering enhanced performance and efficiency to achieve cost reduction and operational optimization.
In extensive clusters with a vast number of queues, particularly within the context of corporate business services and public cloud service scenarios, tens of thousands of partitions and partition leaders exist. Regardless of whether queues contain messages, the volume of messages, or the intensity of traffic, or whether consumers for each partition remain active, as cluster operators, we cannot proactively reduce the number of user partitions. This imposes a tremendous burden on the cluster. Cluster throughput declines sharply as the number of partitions increases, and node failures or restarts trigger partition leader and controller transitions—events that demand the operator’s close attention. These aspects require significant improvement.
Cluster performance should remain consistent regardless of partition growth. Queues with varying traffic volumes need consolidation to enable more efficient message flow—akin to containerized shipping for multiple clients. This is precisely the vision of Stonemq. While solutions like Pulsar utilize journaling for centralized message handling, Stonemq seeks to retain Kafka’s replication , which simplifies and standardizes cluster operation and maintenance.We believe this protocol is both straightforward and highly efficient, forming the backbone of our solution.Additionally, by reusing Kafka’s client-server communication protocol, StoneMQ ensures seamless migration without requiring any changes to the user’s client applications. This approach significantly reduces adoption costs for users, enabling a smooth transition to StoneMQ while retaining the familiar and reliable interface they are accustomed to.
Why Another Message Queue?
Why create a new “wheel”?
Apache Kafka and Apache Pulsar are both outstanding message queue solutions, widely adopted by major tech companies. Examples include Mafka (built on Kafka), DDMQ (built on Pulsar), and cloud service providers like Alibaba Cloud and Tencent Cloud (TDMQ), which have developed excellent products based on these technologies.
However, based on my years of experience in message queue development (having led the development of Mafka for over 4 years and DDMQ for more than 1 year), as well as my expertise in managing and operating large enterprise clusters (exceeding 4,000 virtual machines or containers) with 99.999% availability, I believe these products are not without significant flaws. It is entirely possible to create a better solution.
Kafka’s high throughput and low latency are exceptional. Its distributed design is highly reasonable, and its underlying principles are relatively simple, making it an excellent platform for enterprise-level secondary development. With the integration of auxiliary systems, it’s possible to build highly available enterprise-grade clusters. For a detailed analysis of Kafka’s strengths and weaknesses, you can refer to my earlier blog post on industry research into message queues. Here, I’ll briefly summarize some key points.
Pros of Kafka:
High Throughput and Low Latency:
Kafka excels in throughput and latency due to its use of sequential file I/O for reading and writing messages. This efficient approach achieves exceptional performance with high speeds and minimal delay.High Availability and Reliability:
Kafka employs a distributed system with multiple replicas for each partition. In the event of a node failure, a new leader replica is quickly chosen using Zookeeper’s consistency mechanism, ensuring uninterrupted availability (up to n-1 nodes when replicas = n). With settings like ack=-1 and minInsyncIRS >=2, a message is considered sent only when all replicas are updated, maintaining high reliability by ensuring sufficient synchronized replicas at all times.Simple Scaling and Maintenance:
All machines within the cluster are treated equally, enabling straightforward scaling options. Adding or removing machines can be easily managed by triggering data rebalancing processes.No Java GC-related Issues:
As Kafka writes message data directly to disk, without storing or caching it in memory, it minimizes Java memory usage. This avoids the common garbage collection (GC) problems encountered with Java-based systems.
Cons of Kafka:
System Complexity:
Kafka’s distributed multi-active mechanism introduces complexity, particularly around intra-cluster communication, leader election, partition leader management, topic lifecycle management, and message cleanup. These inter-node RPCs and consistency mechanisms across a complex distributed system create challenges in local data maintenance and pose significant bug risks.Tight Coupling Between Consumers and Partitions:
Kafka enforces a rigid one-to-one relationship between a single consumer and a partition. To increase consumption capacity, you must add more partitions, but this increases partition count, intensifying the cluster’s load and management complexity. This lack of flexibility constrains operational scalability.Dependence on Zookeeper, Increasing Maintenance Costs:
Kafka offloads cluster-wide leader election and consistency management to Zookeeper, necessitating its deployment alongside Kafka. This dependence on an additional component increases system complexity and incurs higher operational and maintenance costs.
In addition to the architectural analysis above, several issues become glaringly apparent when deploying large-scale clusters in real-world production environments:
Exponential Growth of Partitions and Replicas:
Traffic Isolation Leading to Rapid Growth:
To meet business demands, traffic isolation has become a standard requirement in the industry. This often includes isolating environments (e.g., prod, stage, release) or adopting regional/zone-based isolation (commonly termed “set-based” in many companies). A straightforward and efficient way to achieve this is by leveraging queues to simulate separation. However, in a unified company-wide cluster, this requirement is used by various departments, both large and small, leading to exponential proliferation of queues. This queue expansion results in a corresponding increase in partitions, which subsequently causes a multipliers-level surge in replica counts.Consumption Model Leading to Growth:
Kafka’s consumption model enforces that a queue’s partition can only be consumed by a single consumer. When users produce messages using hash keys or when the number of consumers increases, additional partitions must be created to accommodate new consumers. In such scenarios, partition resource consumption does not stem from increased traffic but simply from the growing number of consumers. This tight coupling between the number of consumers and partitions significantly drives up partition counts.
The exponential growth of partitions and replicas leads directly to an increase in the number of fragmented files being written, compounding performance issues. For instance, if a single machine hosts over 3,000 partitions, with three replicas managed, this often approaches 10,000 partitions. This has several critical repercussions:
Disk Random I/O caused by Fragmented Files:
Writing thousands of fragmented files concurrently poses significant challenges. Leader replicas directly influence client-side sending latency as they are written, while follower replica writes—especially with ack=-1 settings—also impact leader latencies. Even during client-side reads (limited to leader replicas), the increased partition count exacerbates random read problems. It’s important to note that even with SSDs, excessive random I/O severely reduces disk performance.Page Cache Pollution:
This issue is inherent to Kafka and escalates sharply with the growth of replica counts on a single machine. Both reads and writes rely on the page cache, but since page cache size is limited, an increase in fragmented files results in heightened contention for cache resources, degrading performance.Flush IOPS Costs During Log Segment Rolls:
Even though these fragmented files are not flushed during writes—relying on follower replicas for durability—Kafka performs a flush when log segments are rolled. This flush operation directly consumes IOPS.
Interaction Between Large and Small Queues:
When two queues with dramatically different traffic patterns (e.g., one with 10x or more throughput than the other) coexist, this imbalance becomes problematic. Large queues require more consumers, which further increases the number of partitions and replicas, ultimately impacting the latency and performance of smaller queues.
Unexpected Backlogs and Reprocessing:
This issue typically arises when slow-consuming queues suddenly resume consumption. If the necessary hot data is no longer in the page cache, data must be fetched from disk, consuming significant IOPS. This behavior disrupts the system’s performance and can lead to unexpected delays.
Poor Controllability of Page Cache:
Since page cache is managed by the operating system, there is minimal control available to users. Configurations are typically limited to tuning parameters like dirty page ratios or flush intervals, without granular control. Users seeking control over caching must resort to application-side caching. However, Java-based languages (such as Java, Scala, or Groovy) often lack the efficiency of system programming languages like C, C++, or Rust when managing memory caches. This inefficiency can result in complications such as memory leaks or Out of Memory (OOM) errors, further deteriorating system reliability.
Pulsar is another highly popular message queue product with a large and active community. The advantages and disadvantages of Pulsar’s architectural design have been discussed in detail in my previous blog, and a brief summary is provided below:
Pros of Pulsar:
Reduced Latency from Slow Nodes:
Pulsar allows messages to be stored on the fastest two nodes, avoiding the latency impact caused by slower nodes during writes.Efficient Cluster Scalability:
When new Bookie nodes are added, they can quickly become part of the Qw (quorum write) group to receive messages, enabling rapid cluster expansion.No Risk of Split-Brain:
Since Pulsar’s architecture lacks the concept of a leader, it avoids the risk of split-brain scenarios caused by network partitioning, which Kafka is susceptible to.
Cons of Pulsar:
Complex Architecture:
Pulsar’s architecture consists of three components: Pulsar, BookKeeper, and RocksDB. Data is distributed across these components, increasing complexity.Complex Data Storage Model:
The smallest storage unit, a fragment, can have its Qa (quorum acknowledgement) spread across multiple Bookies. This results in a massive number of fragmented and scattered fragments throughout the cluster, making maintenance highly complex. Additionally, reading data requires hopping across multiple machines, leading to lower efficiency.Strong Dependency on Zookeeper:
Metadata such as the relationship between ledgers and fragments and their storage locations is stored in Zookeeper. If a Bookie cannot connect to Zookeeper, it stops accepting writes and restarts to maintain consistency. This means that if several nodes or all nodes lose connection to Zookeeper, or if Zookeeper itself fails, the entire cluster becomes non-operational.Inefficient Disk Usage:
Unlike Kafka, BookKeeper does not rely on page cache for writes. Instead, it performs group commits with forced disk flushes. During reads, it relies on file indexing for random reads, which results in overall lower disk efficiency.Data Recovery After Node Failure:
When a Bookie node fails, a significant amount of data must still be moved to create new replicas for disaster recovery. While this is similar to Kafka, Pulsar performs better in that incremental data is not at risk. After a single-node failure, Pulsar can quickly form a new replica group, whereas Kafka must redistribute replicas, leaving both incremental and historical data with reduced redundancy until recovery is complete.
Pulsar Issues in Real-World Production Environments:
Strong Dependency on Zookeeper:
This has been extensively discussed in my previous blog, “Pulsar and the Problem of Removing Zookeeper”. Pulsar’s reliance on Zookeeper is deeply ingrained in its architecture. To ensure consistency, BookKeeper prevents two clients from writing to the same ledger simultaneously. This consistency is enforced by the client relying on Zookeeper’s global coordination capabilities. This dependency is far stronger than Kafka’s reliance on Zookeeper. In Kafka, consistency is managed by electing a single controller node during initialization, which oversees cluster-wide operations. As long as the controller remains operational, Kafka can temporarily function without Zookeeper (albeit with some minor limitations, such as delayed leaderAndIsr notifications and broker state updates). This makes Kafka’s dependency on Zookeeper much less critical in comparison.Memory Leaks and OOM Issues:
Both Pulsar brokers and BookKeeper heavily rely on in-memory caching to improve message read and write efficiency. Many of these caches use off-heap memory. During machine upgrades or maintenance, even small memory leaks can accumulate over time, causing off-heap memory usage to gradually rise and eventually lead to OOM errors. Identifying these memory leaks and performing upgrades and fixes requires significant effort.Loose Architecture with Multiple Components:
Compared to Kafka, Pulsar’s architecture is far more fragmented and challenging to maintain. Pulsar requires familiarity with multiple systems, including Pulsar Broker, BookKeeper, BookKeeper Client (a critical component), and RocksDB. This increases development costs significantly. Similarly, operational and maintenance costs are higher, as these systems require coordinated upgrades and maintenance. In contrast, Kafka’s single distributed system is far simpler. While Kafka’s distributed design is complex, it is well-structured and easier to follow, resulting in much lower maintenance overhead. By comparison, Kafka feels like a paradise in terms of simplicity and manageability.
So, after all this discussion, is there truly a perfect message queue system that can combine the advantages of these technologies while eliminating their disadvantages? Throughout my years of development and maintenance experience, I have constantly pondered this question: can we do better?
Kafka, after version 1.0, shifted its focus towards stream processing, tiered storage, and cloud-native capabilities, yet made very little substantial progress in its core architecture. Similarly, Pulsar has been chasing stream processing and cloud-native trends, while recent efforts have centered on removing its dependency on Zookeeper. These directions, however, are driven by market and capital pressures. But does this mean the architectural evolution of message queue systems has already reached its limit?
It was with this question in mind that the idea for StoneMQ was born.
Conceptual Design
The primary architecture is outlined in the diagram below:
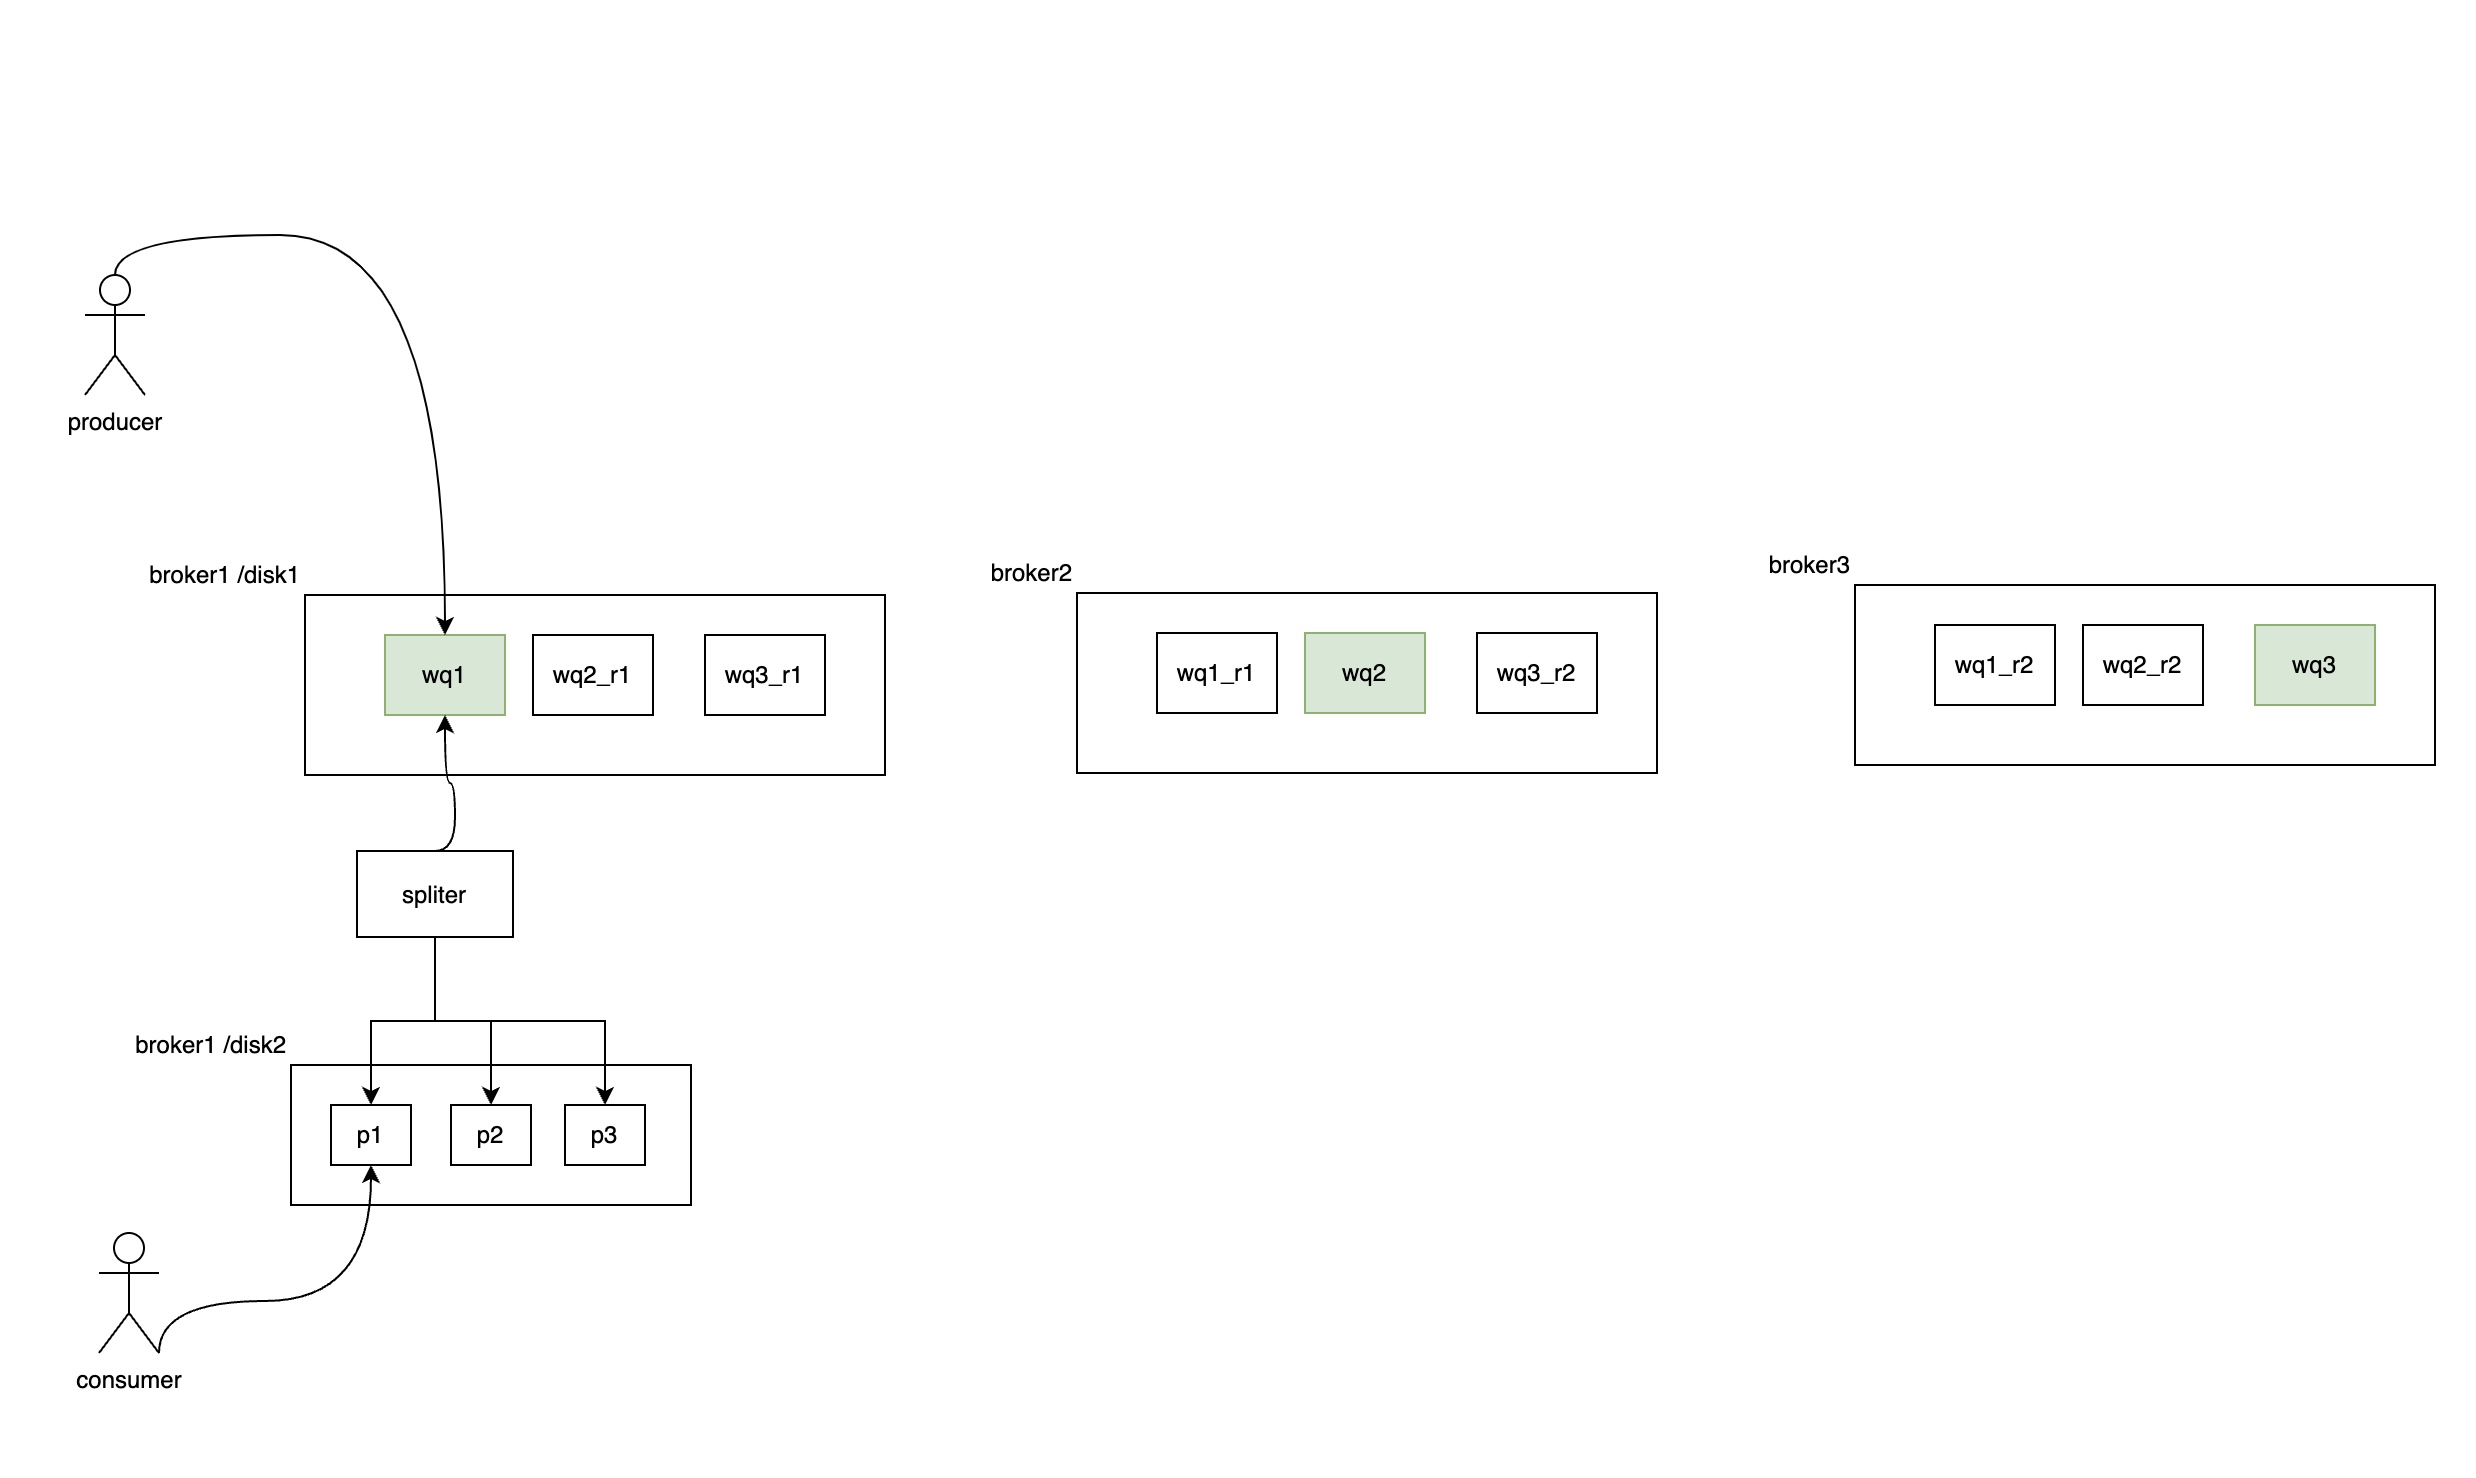
The entire system is designed with a read-write separation architecture. As shown in the diagram, it is a distributed system consisting of multiple brokers (e.g., broker1, broker2, broker3). Each broker contains two disks: /disk1 (write disk) and /disk2 (read disk).
On the write disk (/disk1), partitions such as wq1 (write queue 1), wq2, and wq3 are hosted. For instance, wq1_r1 is the replica of wq1 on broker2, and wq1_r2 is the replica on broker3. Similarly, wq2 and wq3 follow the same pattern. Primary partitions (leaders) are marked in green, while replicas (followers) are marked in white. Messages are written to the leader partition, and replication works similarly to Kafka, with leader and follower replicas synchronizing data.
However, the system limits the total number of partitions to a small, fixed number (e.g., 10 or 20). All queues write their messages into these limited partitions, distributing both write and read responsibilities across all brokers. Writes are concentrated on /disk1, while /disk2 is reserved for reads. The write partitions are asynchronously split into physical queues for long-term storage by a background splitter process. Periodic checkpoints ensure that split messages are written into actual physical queue files on the read disk, which are rolled based on time or size.
The write disk serves as a short-term storage layer, facilitating efficient writes and replication between primary and replica partitions. Meanwhile, the read disk functions as the long-term storage layer, storing messages in their final physical queues. This separation ensures that writes and replications are optimized for throughput, while reads are handled independently.
Key Design Inspirations and Benefits:
Kafka-inspired Write and Replication Mechanism:
By adopting Kafka’s leader-follower replication model, the system ensures high availability and fault tolerance. However, to address Kafka’s scalability challenges caused by excessive partition growth, all queues are consolidated into a limited number of partitions. This reduces the overall partition count in the cluster, significantly improving write and replication throughput.Pulsar-inspired Read-Write Separation:
The system separates read and write operations across two disks. Write operations are concentrated on the write disk (/disk1), while read operations are handled by the read disk (/disk2). This separation eliminates the mutual interference between reads and writes, ensuring that write throughput is unaffected by read operations and vice versa.Optimized Partition Management:
By consolidating all queues into a small number of partitions for writes, the system avoids the exponential growth of partitions and replicas caused by traffic isolation or consumption model requirements. This design prevents the cluster from being overwhelmed by excessive replica counts, fragmented files, and random I/O issues.Improved Consumer Experience:
On the read disk, messages are split into their respective physical queues, presenting real partitions to consumers. This ensures that consumer read operations (e.g., page cache contention or slow consumer IOPS usage) only impact message consumption, not the write path.Rust Implementation:
To address memory leaks and Java GC-related issues, the entire system is implemented in Rust. Rust provides memory safety, prevents common bugs like null pointer dereferences, and eliminates garbage collection overhead. This reduces the system’s memory footprint, freeing up more memory for use as read and write caches.
Why Rust?
Given the increasing adoption of Rust in modern infrastructure projects (e.g., AWS foundational systems, Google Android team, Microsoft investments, and its inclusion in the Linux kernel), it is clear that Rust is a wise choice for building high-performance, reliable systems. Unlike C/C++, Rust offers memory safety without compromising performance, making it an ideal language for this project. By leveraging Rust, the system minimizes memory-related issues and maximizes resource efficiency, ensuring a robust and scalable message queue system.
Detailed Design
1. Message Writing
Multi-Machine Cluster
The cluster consists of multiple machines, typically 5, 10, or more. Zookeeper is used for leader election, selecting the controller for the cluster and the leader replicas for partitions. Metadata is stored in a relational database or a key-value store (KV). Each machine in the cluster maintains the following components:
Two Physical Disks:
- Write Disk: Handles all write operations and replication.
- Read Disk: Stores long-term data and serves consumer read requests.
Limited Partitions per Machine:
Each machine hosts 3-5 write partitions, which are replicated across the cluster to ensure fault tolerance.
Design Principles
Leverage Kafka’s Replication Protocol:
Kafka’s replication protocol is simple, reliable, and elegantly designed. StoneMQ adopts a similar approach for write replication.Avoid Excessive Complexity:
The underlying architecture of StoneMQ is designed to remain straightforward and maintainable.
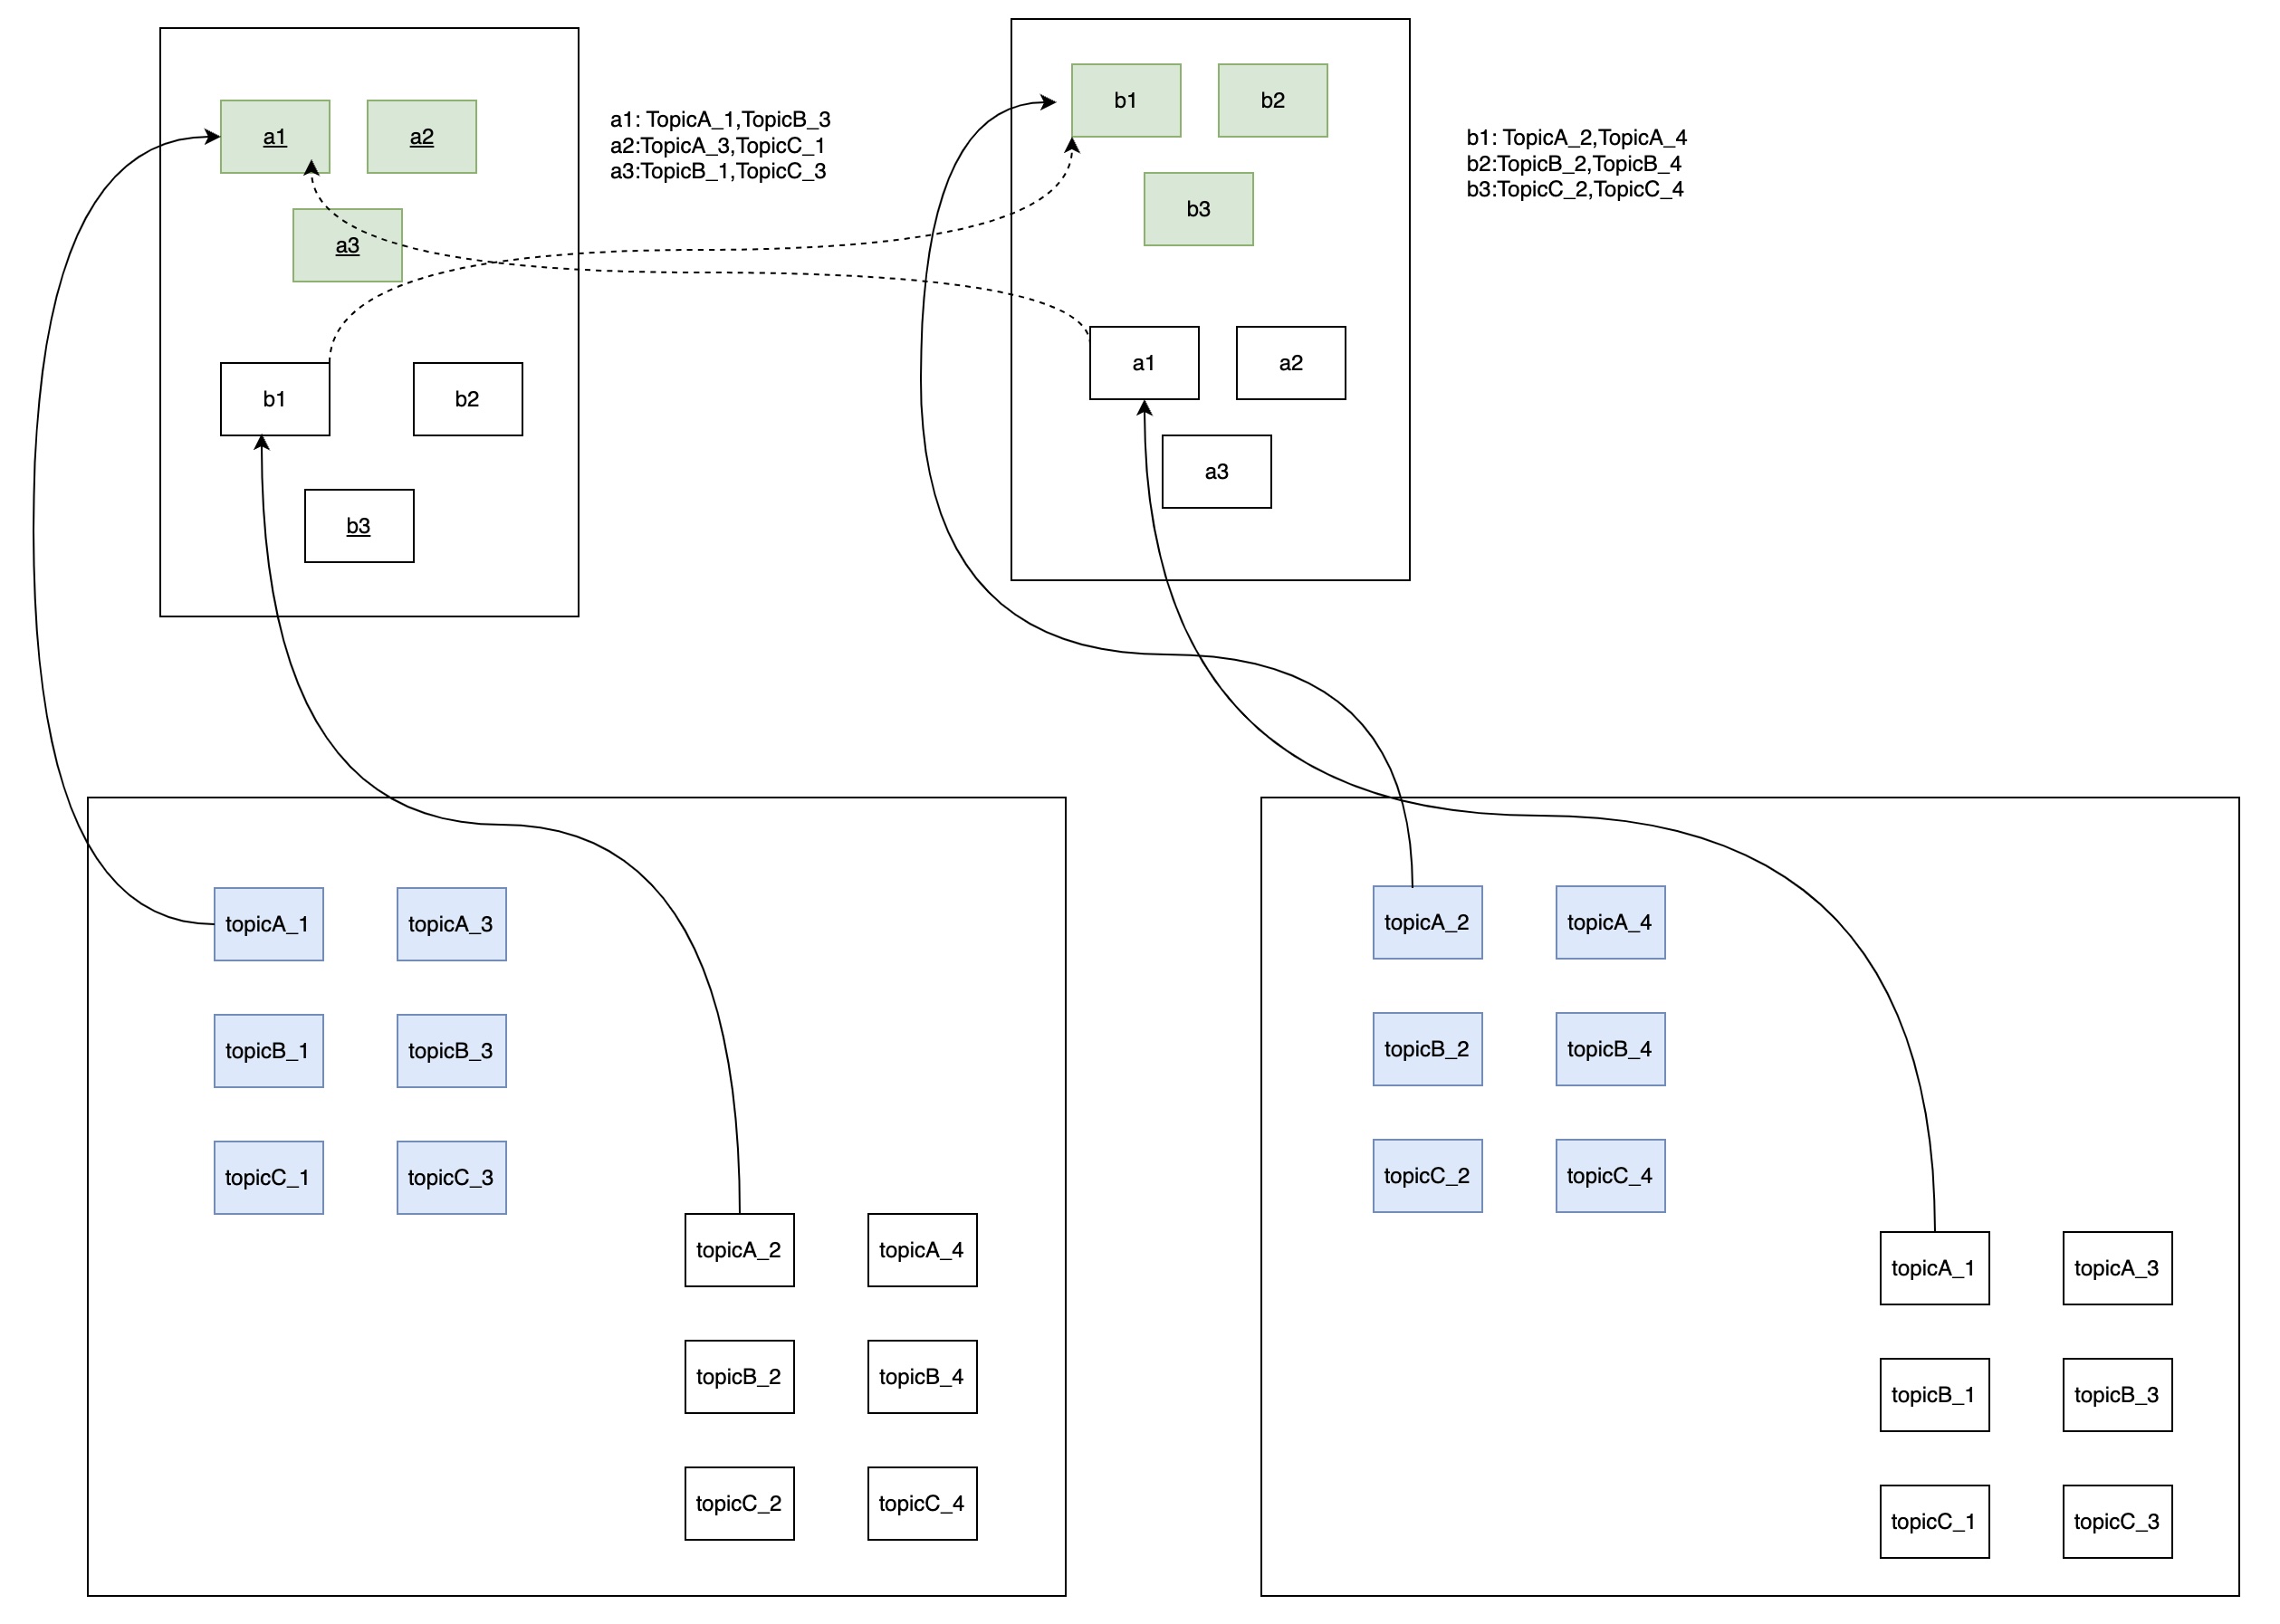
Core Concepts
Partition and Replica Management:
- Each machine hosts leader partitions (e.g.,
a1,a2,b1,b2) and replica partitions. - Write partitions on the write disk replicate data using a protocol similar to Kafka.
- Read partitions on the read disk are managed by a splitter thread, which splits write queues into physical queues and restores the original partition and replica structure.
- Each machine hosts leader partitions (e.g.,
Replication and ISR:
- The ISR (In-Sync Replica) concept is adopted from Kafka to ensure replication consistency.
- Unlike Kafka, there is no HW (High Watermark) concept on the write disk, as it is not used for reads. The splitter process directly reads from the LEO (Log End Offset).
Read Disk Synchronization:
- The splitter thread processes data at different speeds for primary and replica partitions.
- During leader failover, if a replica partition has slower splitting speeds, it must ensure that it can still serve the required offsets.
- When a replica fetches data, it can communicate its splitting progress to determine whether backpressure is needed.
Crash Recovery:
- After a machine restarts, the read replica must synchronize with the primary replica to recover any uncommitted partition files.
Partition Distribution:
- The number of partitions for a topic should be large enough to evenly distribute write traffic across all machines.
- StoneMQ avoids the issue of replica explosion on write partitions by consolidating multiple partitions into a limited number of write queues.
- Even with a high number of real topic partitions, the system efficiently manages replication without excessive overhead.
Simplified Write Queue Design:
- Write queues do not require time index
- The splitting process from write queues to read queues is inspired by Pulsar’s journal and entry log concept.
Write and Split Process
Write Disk Operations:
- Producers send messages to the write partitions on the write disk.
- Messages are replicated to follower replicas using a Kafka-like protocol.
- The write disk only serves as short-term storage for incoming messages and replication.
Splitter Thread:
- The splitter thread periodically reads from the write queues on the write disk and splits data into read partitions on the read disk.
- Splitting is asynchronous and checkpointed to ensure fault tolerance.
- Data is written to physical queue files on the read disk, which are rolled based on time or size.
Read Disk Operations:
- The read disk serves as long-term storage and handles all consumer read requests.
- It restores the original partitioning structure of the topic, ensuring that consumers see the expected partition layout.
- The read disk’s separation ensures that consumer activity does not interfere with write operations.
Advantages of the Design
- Scalable Partition Management:
- By consolidating multiple topic partitions into a limited number of write partitions, the system avoids the performance degradation caused by excessive partition growth, a common issue in Kafka.
- The actual number of topic partitions can be large without impacting write throughput or replica overhead.
- Read-Write Separation:
- Writes are isolated on the write disk, while reads are handled independently on the read disk.
- This separation ensures that consumer activity (e.g., slow consumers, high IOPS usage) does not affect message ingestion or replication.
- Fault Tolerance:
- The ISR mechanism ensures data consistency during replication.
- Crash recovery mechanisms allow replicas to synchronize and restore uncommitted data after machine restarts.
- Efficient Resource Utilization:
- The system avoids replica proliferation by consolidating write partitions.
- Splitting data into read partitions ensures optimal long-term storage and read performance.
Key Challenges and Solutions
Split Speed Discrepancies Between Primary and Replica Partitions:
- During leader failover, slower replica splitting speeds may cause data availability issues.
- Solution: Replicas communicate their splitting progress, and backpressure mechanisms ensure that consumers do not request unavailable offsets.
Crash Recovery for Read Partitions:
- Read replicas must recover uncommitted partition files from the primary replica.
- Solution: Implement efficient synchronization protocols for restoring missing data.
Scalability with Large Topic Partition Counts:
- While the system consolidates write partitions, it must still handle large numbers of topic partitions for reads.
- Solution: The read disk restores the original partition layout, ensuring that consumers see the expected structure without impacting write performance.
This design combines the best aspects of Kafka’s replication protocol and Pulsar’s journal-entry log architecture to create a scalable, efficient, and fault-tolerant message queue system.
2. Crash Recovery Design
Crash recovery in StoneMQ is designed to ensure data consistency and minimize data loss while maintaining high performance. The recovery process involves both journal log and queue log restoration, with mechanisms in place to handle various failure scenarios. Below is the detailed recovery strategy:
1. Leader Failure Recovery
- When a leader partition crashes, one of its follower replicas is elected as the new leader using Zookeeper’s election mechanism.
- The new leader takes over write and replication responsibilities, ensuring minimal disruption to the system.
2. Machine Crash Recovery
When a machine crashes and restarts, the recovery process involves the following steps:
Step 1: Restore Journal Log
Journal Log Characteristics:
- The journal log is a short-term, write-ahead log that uses Kafka’s replication protocol.
- Due to the dual-write mechanism (at least two replicas), the journal log is highly reliable and unlikely to lose data.
Recovery Process:
- The journal log recovery point is independent of the queue log and is maintained separately.
- The system uses the recovery point to determine where to resume fetching data from the primary replica.
- Once the journal log is fully restored, the system proceeds to queue log recovery.
Step 2: Restore Queue Log
Queue Log Characteristics:
- The queue log represents the long-term storage on the read disk.
- During normal operation, the queue log periodically flushes its data and records the physical position in the journal log.
Recovery Process:
- The recovery point for the queue log is the last recorded physical position in the journal log.
- The system begins restoring the queue log from this position, ensuring that all data is consistent with the journal log.
Key Features:
- Dual-Writing Guarantees:
The dual-write mechanism ensures that the journal log is always available for recovery, even if the queue log is partially lost. - Separation of Recovery Points:
- Each log (journal and queue) maintains its own recovery point for independent restoration.
- This modular approach simplifies the recovery process and reduces interdependencies.
3. Handling Single-Machine Mode
In single-machine mode, the journal log is more vulnerable to data loss because there are no replicas. To mitigate this risk, the following temporary solution is implemented:
Synchronized Flushing:
- Whenever the queue log flushes its data, the journal log is flushed as well.
- This ensures that the journal log is always consistent with the queue log.
Performance Considerations:
- This approach is only a temporary solution for single-machine mode. Once dual-machine replication is enabled, the journal log flush frequency returns to normal.
- In practice, the journal log is already flushed more frequently than the queue log, so the performance impact is minimal.
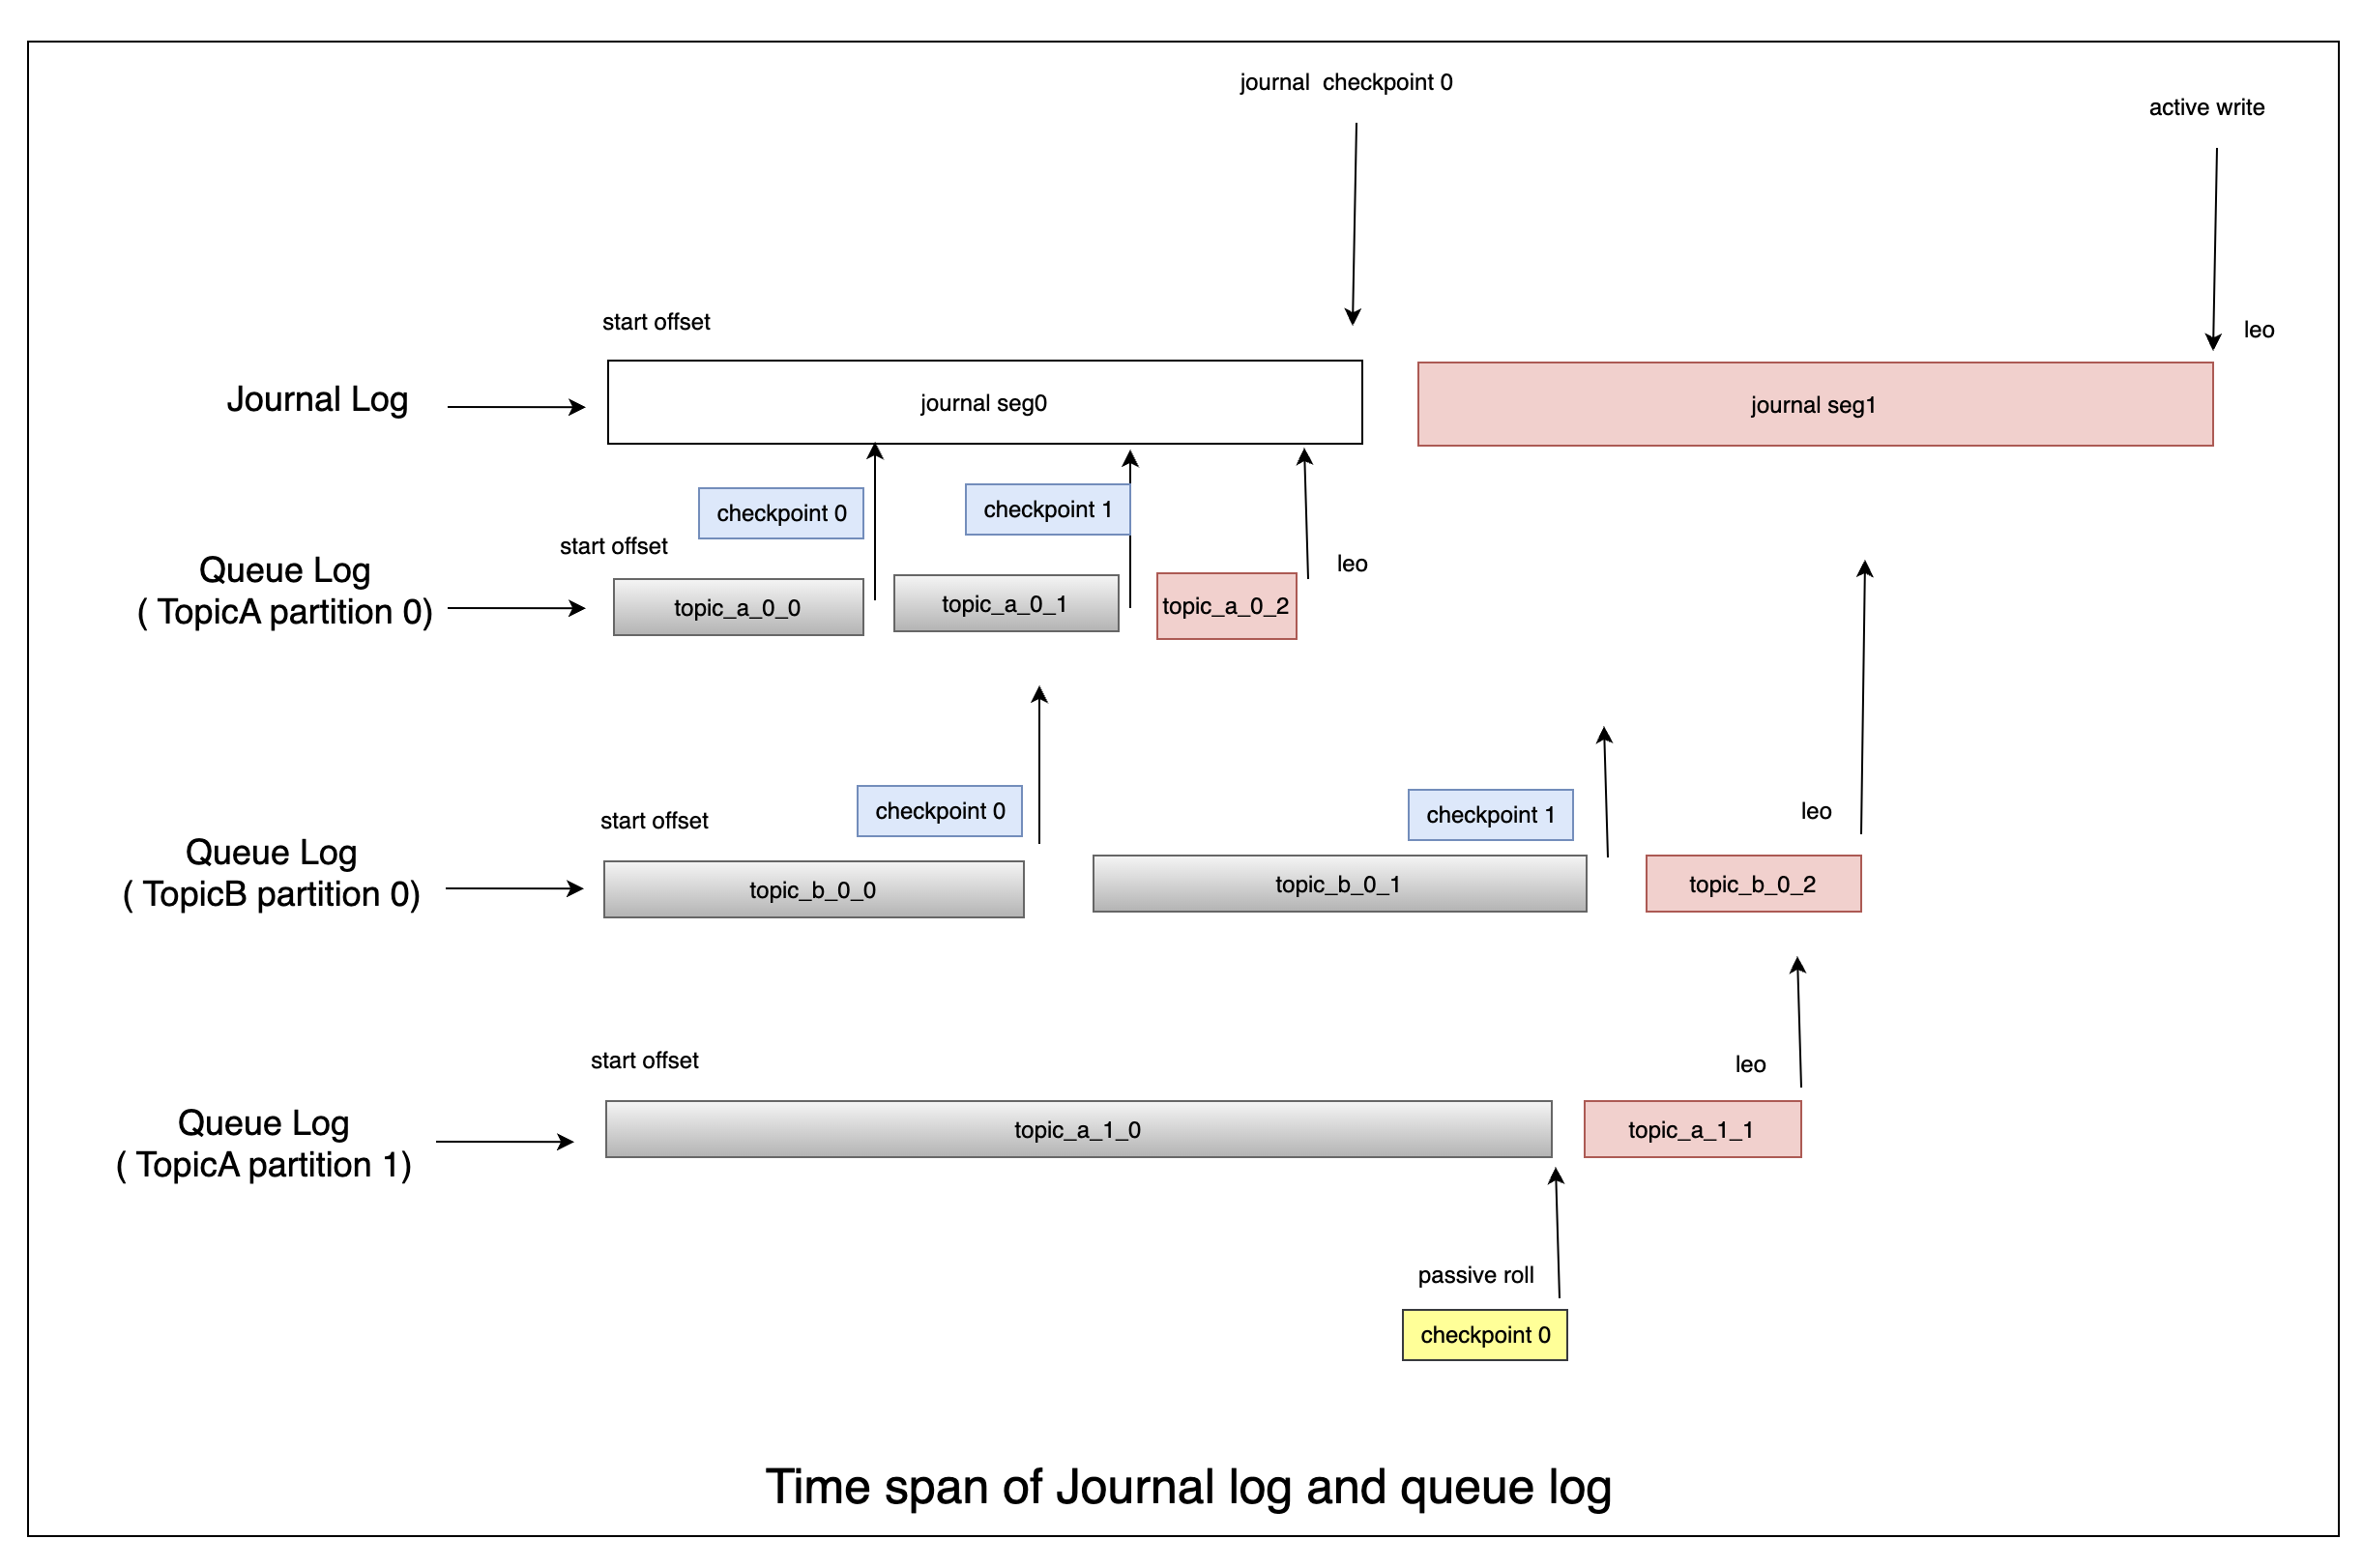
4. Checkpoint Management
Checkpoint Definition:
- A checkpoint is a record stored at the end of each journal log segment. It maps the physical positions of all corresponding queue logs.
- Checkpoints are used to synchronize journal and queue log recovery.
Queue Log Checkpoints:
- Each time the queue log rolls to a new segment, it flushes its data and updates the recovery point.
- The system periodically persists these recovery points to ensure they are available during crash recovery.
Journal Log Checkpoints:
- The journal log periodically deletes expired segments based on the minimum recovery checkpoint across all queue logs.
- This ensures that the journal log does not grow indefinitely and only retains relevant data for recovery.
Handling Long-Idle Queue Logs:
- If a queue log does not roll for an extended period (e.g., no new messages are added), the checkpoint monitoring thread periodically forces a roll.
- This ensures that recovery points remain up-to-date and prevents the journal log from retaining unnecessary data.
5. Summary of Recovery Workflow
Crash Detection:
- Upon detecting a machine crash, the system identifies the affected partitions and begins the recovery process.
Journal Log Recovery:
- Restore the journal log using the replication protocol.
- Use the journal log recovery point to fetch missing data from the leader replica.
Queue Log Recovery:
- Restore the queue log by reading from the journal log starting at the last recorded physical position.
- Synchronize the queue log with the journal log to ensure consistency.
Checkpoint Synchronization:
- Use checkpoints to align recovery progress between journal and queue logs.
- Periodically update and persist checkpoints during normal operation to simplify recovery.
6. Advantages of the Design
Fault Tolerance:
- The dual-write mechanism ensures that the journal log is always available, even during partial failures.
- Independent recovery points for journal and queue logs provide modularity and robustness.
Minimal Data Loss:
- By flushing the queue log and journal log together in single-machine mode, the risk of data loss is minimized.
- Checkpoints ensure that recovery always starts from a consistent state.
Efficient Log Management:
- The journal log automatically deletes expired segments based on the minimum recovery checkpoint, preventing unnecessary growth.
- Idle queue logs are periodically rolled to keep checkpoints up-to-date.
Scalability:
- The recovery process scales well in multi-machine clusters due to the separation of journal and queue log recovery.
- Recovery is optimized for both single-machine and multi-machine deployments.
7. Open Questions and Future Enhancements
Optimizing Single-Machine Mode:
- Explore more efficient ways to handle journal log durability without frequent flushes in single-machine mode.
Dynamic Checkpoint Management:
- Investigate adaptive checkpointing strategies to balance recovery speed and runtime performance.
Enhanced Monitoring:
- Implement detailed monitoring and alerting for checkpoint progress, journal log growth, and recovery performance.
This crash recovery design ensures data durability, fault tolerance, and efficient log management, making StoneMQ highly resilient to failures.
Title: Announcing Stonemq: A high-performance and efficient message queue developed in Rust
Author: Rex Wang rexwang735@gmail.com
Date: 2025-02-10
Last Update: 2025-06-18
Copyright Declaration: Plz credit the original source when reposting
Aktie